Building a Data Pipeline to Support Analyzing Clickstream Data with AWS.
Basically what we are dealing with is Anycompany sells its desserts foods through its website and they want to gain insights into the business by using data about how people interact with the website. The company plans to analyze clickstream data trends to make smarter decisions about where to invest.
Task 1: Analyzing the website and log data
But before that, always follow the AWS best practices and the AWS well-architected framework. But this is a project for demonstration purposes as required.
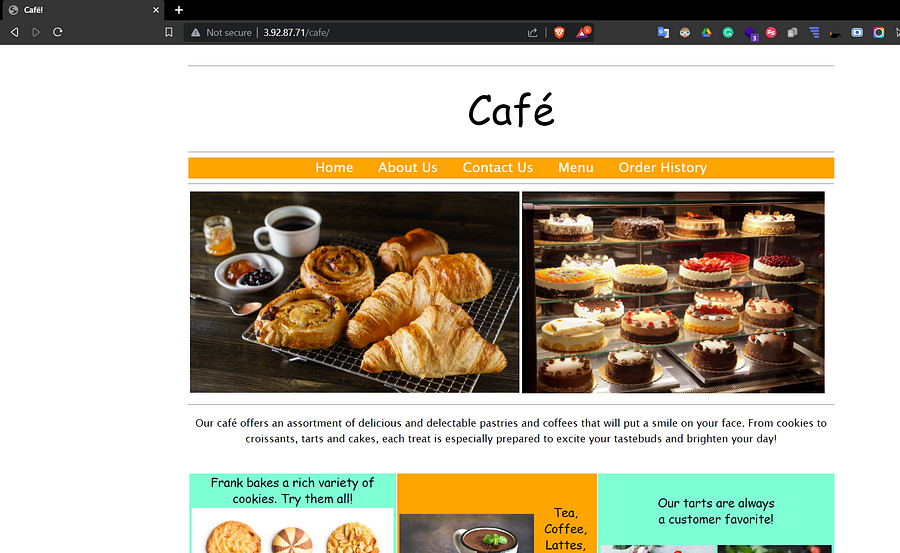
Since our application is already running on an EC2 instance, running on Apache web server, we should make it accessible to the public internet by allowing HTTP port 80 access on security group settings for the EC2. Next, we will open our website by placing the public IP.

Next, we will connect our Cloud9 environment to our EC2 instance You can view how to connect here. Since our cafe application runs on Apache web server, the default log files are in /var/log subdirectory. In order to track changes in our web server we will use the tail command here. So anything that happens on our website, a new log entry is made on our access_log. Then we will need to backup our access log to the following directory:
sudo cp /var/log/httpd/access_log /home/ec2-user/environment/initial_access_log
Task 2: Installing cloudwatch agent and configuration file
Next, we will install the Cloudwatch agent, to install cloudwatch agent run the following command in the Cloud9 terminal:
sudo yum install -y amazon-cloudwatch-agent
Next, we will install the Cloudwatch agent configuration file using the following command:
wget https://aws-tc-largeobjects.s3.us-west-2.amazonaws.com/CUR-TF-200-ACCAP4-1-79925/capstone-4-clickstream/s3/config.json
Next, we will move the cloudwatch agent configuration file to the following sub-directory using the following command
sudo mv config.json /opt/aws/amazon-cloudwatch-agent/bin/
To view the contents of the file, you can use the cat command
sudo cat /opt/aws/amazon-cloudwatch-agent/bin/config.json
The file contains the following:
-Which logs to collect from the café web server
-Which log group in CloudWatch to place the logs in
-How long to retain the logs
-Which metrics to collect and how to aggregate them
Next, we will modify the web server configuration file httpd.conf from the default Common Log Format (CLF) to JSON format. The file is in /etc/ directory. This will allow the CloudWatch agent to send the log files to CloudWatch log groups. First lets work with the error Log configuration. For Linux terminal commands help here. Replace the line that reads ErrorLog "logs/error_log" with this line :
ErrorLog "/var/log/www/error/error_log"
Again we will immediately add the following line after the previous line above
ErrorLogFormat "{\"time\":\"%{%usec_frac}t\", \"function\" : \"[%-m:%l]\", \"process\" : \"[pid%P]\" ,\"message\" : \"%M\"}"
Next will work with the access log configuration on the same file. Go to the line that reads which contains LogFormat "%h %l %u %t \"%r\" %>s %b \"%{Referer}i\" \"%{User-Agent}i\"" combinedand comment it out. Copy and paste the following text immediately after the line LogFormat "%h %l %u %t \"%r\" %>s %b" commonand place them with the following line:
LogFormat "{ \"time\":\"%{%Y-%m-%d}tT%{%T}t.%{msec_frac}tZ\", \"process\":\"%D\", \"filename\":\"%f\", \"remoteIP\":\"%a\", \"host\":\"%V\", \"request\":\"%U\", \"query\":\"%q\",\"method\":\"%m\", \"status\":\"%>s\", \"userAgent\":\"%{User-agent}i\",\"referer\":\"%{Referer}i\"}" cloudwatch
Go to the line that reads CustomLog "logs/access_log" combined Add the following text as a new line immediately after the CustomLog line
CustomLog "/var/log/www/access/access_log" cloudwatch
Save and close the file.
Next, create access and error log directories since they are already specified in the httpd.conf and already exist on the server.
Restart the httpd by typing the following command in the Cloud9 terminal
sudo systemctl restart httpd
Again Restart the Cloudwatch agent using the following command:
sudo systemctl restart amazon-cloudwatch-agent.service
Confirm the status of the cloud watch using the following command
sudo service amazon-cloudwatch-agent status
Task 3: Testing the cloudwatch agent
We will return to the cafe website and do some actions like purchasing an order.
Go to the amazon-cloud watch-agent.log file and see the contents of the file using the cat command, Also, confirm the cloudwatch agent is reading from the two webserver files. Also to confirm these logs are sent to Cloudwatch, go to the Cloudwatch console, open log groups, and open log stream, and expand one log stream contents which are in JSON format.
Task 4: Using the simulated log and ensuring that CloudWatch receives the entries
In this task, we will replace the access_log file with the one with simulated data. The simulated log file has more entries. The file is in the sample logs directory. To view the first lines run the following command
cat samplelogs/access_log.log | head
Next, we stop the cloudwatch agent using the following command:
sudo /opt/aws/amazon-cloudwatch-agent/bin/amazon-cloudwatch-agent-ctl -m ec2 -a stop
Now replace the simulated file where CloudWatch expects to find it and rename it access_log.
Restart the cloudwatch agent using:
sudo /opt/aws/amazon-cloudwatch-agent/bin/amazon-cloudwatch-agent-ctl -m ec2 -a stop
Next, confirm more entries are made to the cloudwatch log group.
Task 5: Using CloudWatch Logs Insights for analysis
Since the CloudWatch agent is collecting and sending the simulated log data to CloudWatch, you will use CloudWatch Logs Insights to run queries on the access_log data.
We will demonstrate using one example of users who accessed our menu.
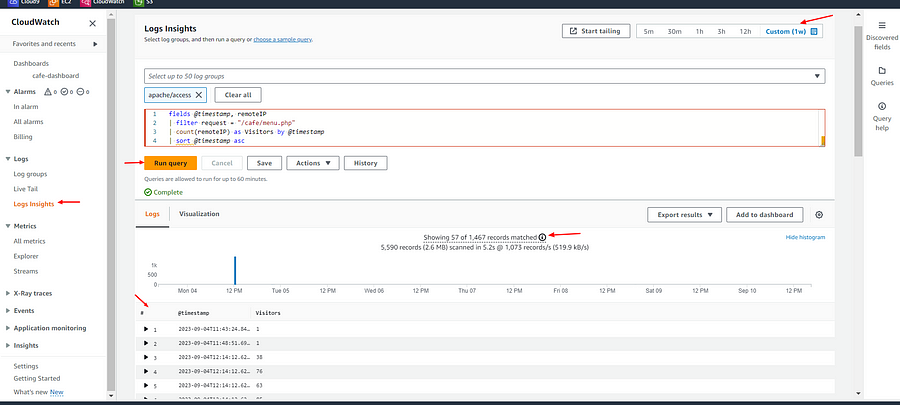
Go to the log insights tab in Cloudwatch and run the following in the query
fields @timestamp, remoteIP
| filter request = "/cafe/menu.php"
| count(remoteIP) as Visitors by @timestamp
| sort @timestamp asc
The results are summarized as records that matched (X) of the total records that were scanned(Y).

Task 6: Adjusting the pipeline to deliver new insights
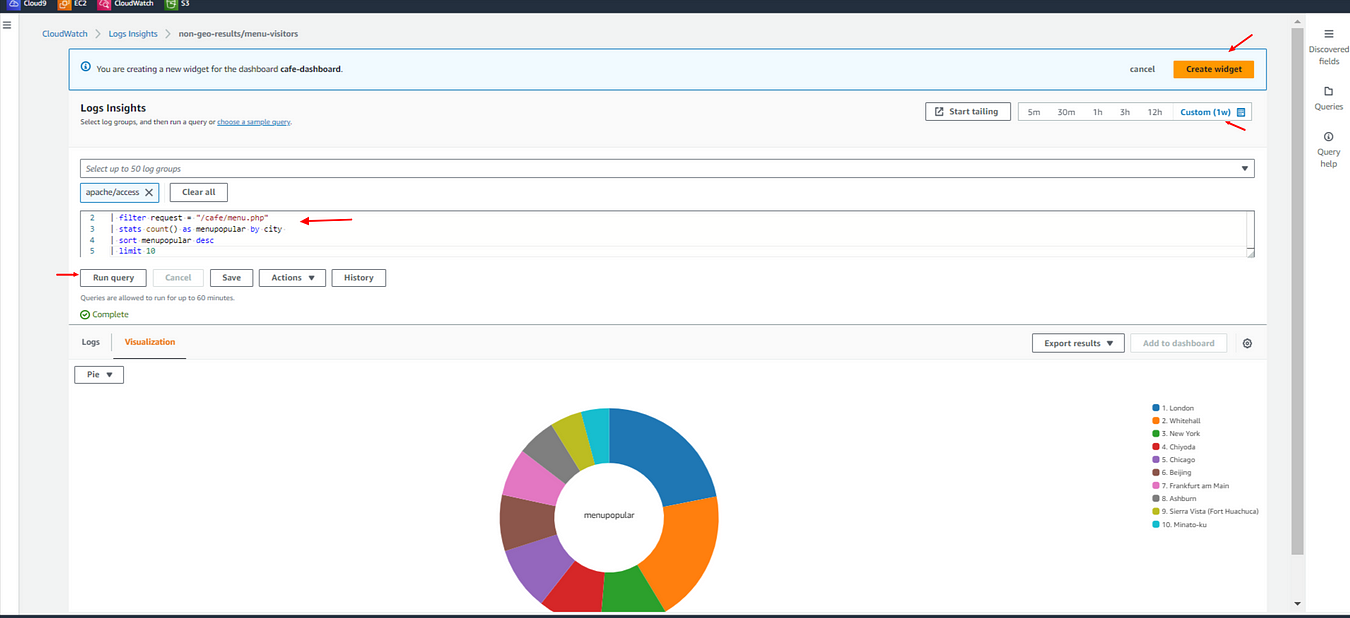
Next, we will build a dashboard for users who accessed our menu page from the top 10 regions around the world. We will use the previous results of our example. But first, we need to use the geo_location log file as our new access log. To do that we will stop the cloudwatch agent, replace the geolocation log file, paste it where cloudwatch expects to find it, and rename it to acccess_log. Next, delete the log group from the Cloudwatch console, recreate the Cloudwatch log group via cli here, and later restart the Cloudwatch agent.
Next task we will create a cloudwatch dashboard called cafe-dashboard.
Next, add a pie chart to the widget type using the following:
Widget type: Pie
Data source: Logs
Period to query: Custom (e.g. 1 week)
Log groups to query: apache/access.
Query to run
fields remoteIP, city
| filter request = "/cafe/menu.php"
| stats count() as menupopular by city
| sort menupopular desc
| limit 10
Run the query.

The pie chart appears.
Choose Create widget. The widget is added to the dashboard.
Hover on the Log group: apache/access the title of the widget and choose the edit icon.
Rename the widget as Cities visiting the menu the most
Choose Apply.
On the dashboard page, choose Save in the top-right corner.

A Pie chart showing Cities that visited the menu the most.
The same method is applied to the following:
-Regions visiting the website the most.
-Cities placing the most orders.
-Regions placing the most orders.
Next task we can back up our log file to the S3 bucket with the help of AWS cli here: Later we can run SQL queries to query the logs that are stored in S3 using the S3 SELECT command here and compare them to the results of cloudwatch insights results.